👣 Getting Started
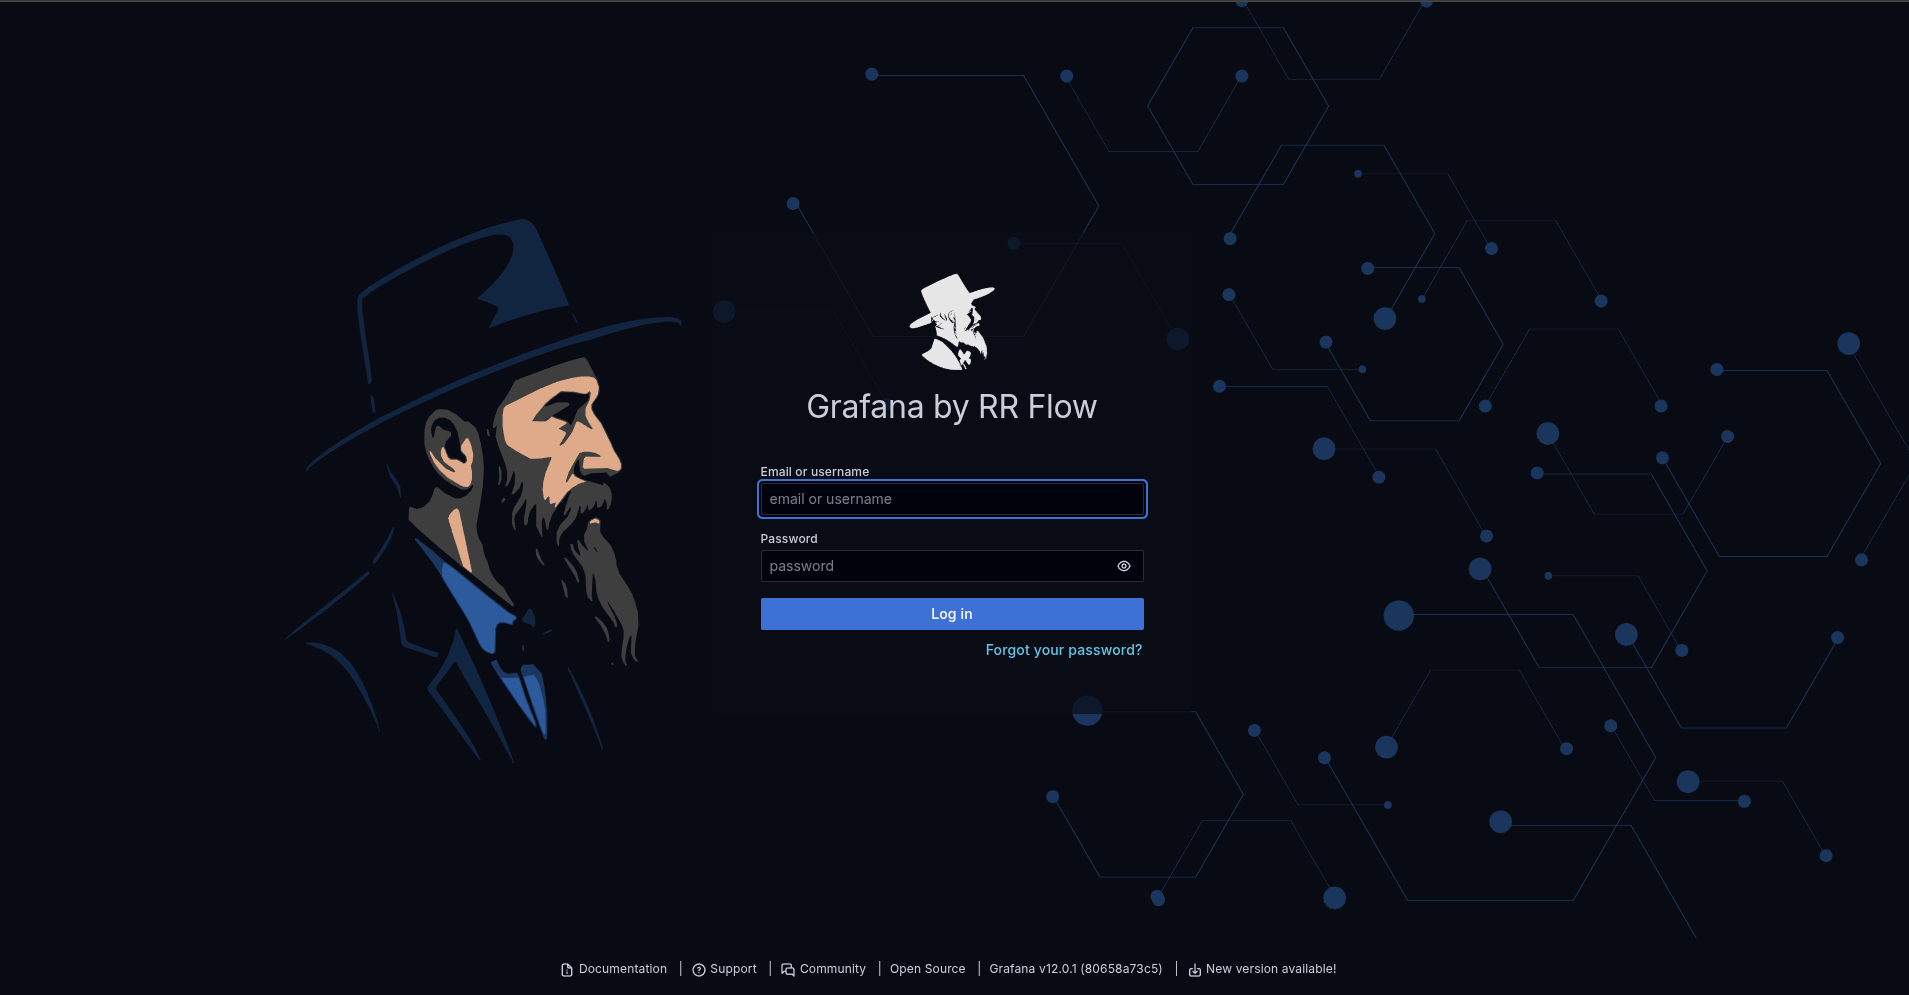
Accessing Grafana
Grafana will be available on port 3000. To access it, use the following link: http://your_ip:3000
Note
The default username and password are both admin. Change them!
The first time you log in, you will be prompted to create a new password to ensure secure access.
Accessing RR Flow API
The API will run on port 5000. To access it, use the following link: http://your_ip:5000/admin

Note
The default password is remontti
1st Data Source
To add your first data source (“Flow”/”Router”), review the structure of the configuration file config.json to better understand the overall context.
You can find the config.json file by accessing the Admin Panel under the Settings menu.

Next, proceed with the 1st source_path and set up the integration with your router.
Once your router is integrated, restart the API.
Getting SNMP Data
With your source_path configured, go to the Admin Panel, and access the menu Get SNMP Data
To test if SNMP communication with your router is working, click the Test button.
If it’s working, a SNMP OK message will appear. Now just click Get Interfaces and then Get Peers.
If you have any issues, check if your router is authorized to respond to queries from your RR Flow server address. You can find here some tools to debug this type of problem.
Once you have imported Interfaces and Peers, read the documentation for the interfaces.json file. Then, in the Admin Panel » Settings, find the interfaces.json file and edit it, adjusting upstream interfaces to “type”: 1.
Congratulations!
Your RR FLOW is now almost ready for use. To further enrich your data, it is essential to read the documentation.
-
Main files you should adjust:
- notify.json)
- Set up integration with Telegram and Emails
- my-prefix.json
- Register all your prefixes for your ASN
- data_traffic_analysis.json
- Here you can set up alerts as well as custom scripts.
- fav-asn-prefix-graphs.json
- You can create a list of favorite ASNs or Prefixes, and you will also include information about CDNs here.
- notify.json)
-
It is very important to understand how Manual Filters work within the application, as these will take your knowledge to the next level. In various dashboards, you will find fields to type these filters, or in configuration files such as:
- data_traffic_analysis.json - (Data traffic analysis)
- custom-filters.json - (Custom filters)
-
I recommend watching the Video Tutorials here
External Grafana (Optional)
Requires advanced knowledge. (Not recommended)
License & Agreement
License: https://doc.rrflow.com.br/obter_licenca/#licenca-de-uso
Agreement: https://doc.rrflow.com.br/contrato/
Caution
If Grafana is running on an external server, I am not responsible for any accidental removal of other dashboards. I recommend installing each dashboard individually to avoid unwanted losses, or use the Grafana instance from the RR Flow API installation. Only Dashboards with the following TAGs will be removed:
RR-FLOW-M RR-FLOW RR-INFO RR-FLOW-HOME RR FLOW
Integrating the API with External Grafana
-
JSON API
- Go to: Home page » Connections » Data sources
- Then click on [Add data source]
- Search for [JSON API] and click on it.
- In the URL field, add http://ip-of-rr-flow-api:5000 and set Timeout to 600
- Click [Save & test], but before leaving, notice that in the URL, after “/edit/”, you will see the JSON API datasource uid.
-Ex:
http://192.168.87.28:3000/connections/datasources/edit/d686f6a48c4a - Write down the datasource id:
- Ex.:
d686f6a48c4aHome page
- Ex.:
-
Service accounts
- Home page » Administration » Users and access » Service accounts, we will now create a Token (Grafana API). This step is crucial to automate dashboard imports via RR Flow.
- Click on [Add service account]
- Fill in the fields Display Name: RR Flow API and Role: Admin and click [Create]
- Click on [Add service account token]
- Click [Generate token]
- Click [Copy to clipboard and close]
- Write down your token
- Ex.:
glsa_pUL0p6xJMpaY2ZaIVCClX4secEadvNNK_e835939c
- Ex.:
Now, in the RR Flow API Admin Panel, go to Settings » Edit the config.json
Adjust datasources, service_token, and your grafana url:
    "grafana": [
        {
            "datasources": "d686f6a48c4a",
            "service_token": "glsa_pUL0p6xJMpaY2ZaIVCClX4secEadvNNK_e835939c",
            "url": "http://your-grafana-address:3000"
        }
    ],
Click [Save], and [Restart the API]
Now in the Grafana menu you will find all the dashboards ready for installation.


